What makes chess one of the rare competitive pursuits where experience, steady practice, and sporadic bursts of youthful creativity all coexist at the top — and what does that tell us about how we should train, compete, and design programs for elite players?
That question has been sitting with me while I worked through the dataset and charts for this report on 1,200 elite FIDE players across 78 federations. Below I walk you through what I’ve learned so far, what still confuses me, what surprised me, and how I’d think about next steps if I had more time. I’ll keep the structure clear and the charts intact — every figure name and path is preserved so you can re-use or inspect them directly.
Executive reflection — quick preview
We’re looking at a highly active, globally distributed elite: 1,200 players, 78 federations, 872 Grandmasters (72.7%), and nearly universal tournament engagement (97.8%). Ratings cluster tightly (mean ≈ 2,518) with a long elite tail (top = 2,839). On the surface that paints chess as both specialized and broadly inclusive: many reach elite status, and the very top still clearly stands apart.
What surprised me (and why it matters)
Age barely matters at the elite level. Correlation between age and rating is essentially negligible (−0.037). That surprised me because many sports show steep declines with age; chess appears to resist that pattern among elites. It suggests an extended peak-window where accumulated knowledge and pattern recognition compensate for modest cognitive slowing.
Almost everyone competes. 97.8% recent tournament activity (1,174/1,200) — elite chess is not a passive club of theoreticians; it’s an actively competing community. That’s important for organizers and federations: competitions are the lifeblood keeping skills sharp.
Cross-format skill transfer is strong. Correlations across classical/rapid/blitz (≈ 0.717–0.771) means training in one format benefits others. This undermines the simplistic “blitz is a separate skill” narrative at elite levels — fundamentals carry over.
Different national strategies succeed. India supplies the largest number of elite players (81), while the USA has the highest average rating (2,546). Both approaches produce excellence — one through breadth, the other through peak optimization.
What I learned — guided tour through the findings (with preserved charts)
Note: every chart referenced below is included exactly as in the report; file names and paths are preserved for reproduction.

Rating distribution and elite tail
Finding: Most elite players cluster near the mean rating (≈2,518) while a small elite tail (up to 2,839) marks world-championship caliber outliers. Practically, this suggests marginal improvements at the top are very hard and often separate the “top” from the “very top.”

Age versus performance
Finding: Age has minimal impact (correlation −0.037). What this means in practice: players in their 30s and 40s often match or exceed younger players — probably a mix of experience, opening knowledge, and more efficient thinking patterns.

Cross-format rating correlations
Finding: Strong correlations (0.717–0.771) between classical, rapid, and blitz ratings. That’s a practical signal to coaches: build fundamentals (calculation, pattern recognition, opening understanding) and expect benefits across formats.

Time-control performance differential
Finding: On average, players score ~41 points higher in classical than blitz. Classical rewards deeper analysis; blitz rewards speed and intuition. A balanced training program ought to respect both demands.

Federation participation leaders
Finding: India leads participation with 81 elite players, followed by Russia (74) and the USA (69). This reflects chess’s globalization — development pipelines work differently across countries.

Federation strength (average rating)
Finding: USA has the highest average rating (2,546) despite fewer elite players than India. Different models: mass development vs. focused elite development.

Global geographic distribution
Finding: Europe remains dominant (482 players, 40.2%), but Asia’s presence is substantial (341, 28.4%) — chess is becoming genuinely global.

Age-group patterns and peak age
Finding: Most players are 20–30 (397 players, 33.1%).

Rating by Age Bracket
Finding: The 31–40 bracket enjoys the highest mean rating (2,526). That sweet spot feels like the intersection of experience and preserved cognitive resources.

Titles and rating stratification
Finding: 72.7% of the dataset are Grandmasters (872).

Rating by Title
Finding: Grandmasters average 2,538, about 73 points above International Masters. Titles remain meaningful differentiators.

Top players (leaderboard snapshot)
Finding: Magnus Carlsen leads at 2,839, followed by Nakamura, Erigaisi, Caruana, and Gukesh. The top few still stand noticeably apart, but the gap to the broader elite is not infinite.
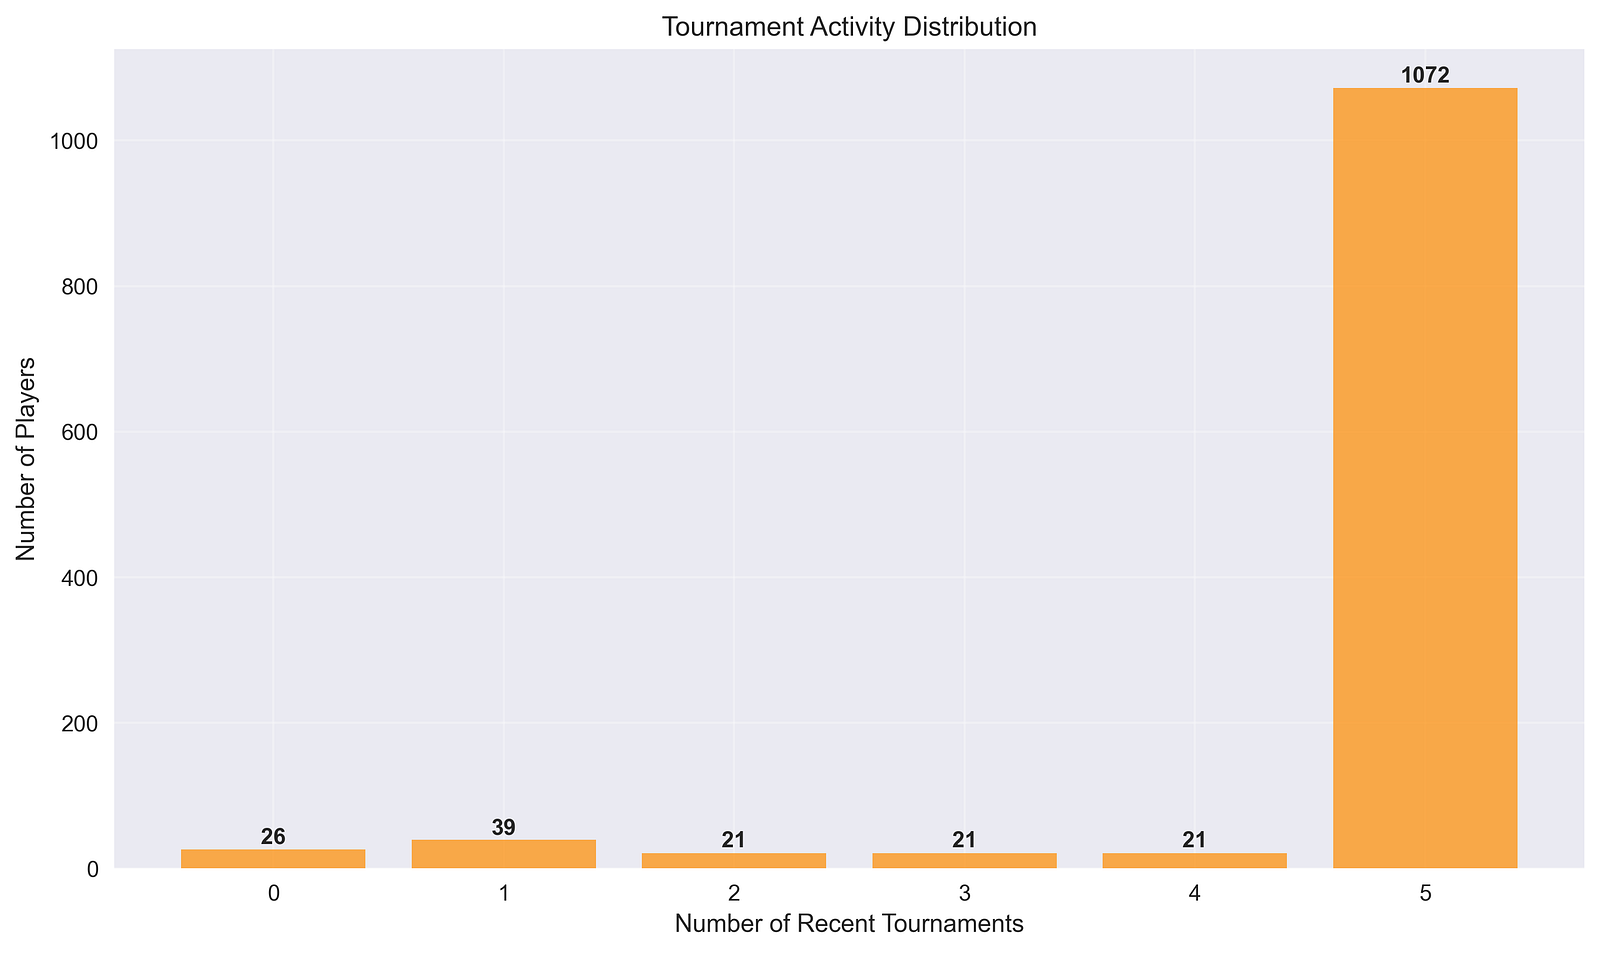
Tournament participation and its impact
Finding: 97.8% active; average 4.7 recent tournaments per player.

Active vs Inactive
Finding: Active players average 31 points higher than inactive players (2,519 vs 2,488). Active competition appears essential to maintain elite performance.
Where the data gets confusing or limited
Causal direction on activity and rating. Active players have higher ratings, but does activity raise rating, or do higher-rated players get invited more and therefore stay active? The correlation is clear; causation is not.
Selection bias in the dataset. We focused on 1,200 “elite” players — the conclusions apply to elites only. How representative are these findings for the broader chess-playing population or rising talents? Not very. If you want to generalize to national pipelines, you need a broader sample.
Time dynamics and trends. We have a snapshot of recent activity and ratings, but how these metrics evolve longitudinally (e.g., trajectories of players who become elite at 18 vs 28) needs longitudinal data. This report does not fully resolve that.
Federation-level confounders. Differences between federations (training infrastructure, selection bias, GDP, culture) are not controlled for. Saying “India has many elites” doesn’t explain whether this is due to systematic coaching, demographics, or selection thresholds.
Psychological and non-rating factors. Ratings and titles capture much, but not all: motivation, coaching relationships, sponsorship, and life events influence careers but are not present in the dataset.
Everyday examples that make this feel real
The “age durability” I find believable if you think of chess like language fluency: a 40-year-old who has read thousands of books and practiced conversationally for decades can still out-debate a younger but less experienced interlocutor. Pattern recognition and accumulated knowledge compensate for small losses in processing speed.
Tournament activity advantage is like language immersion: if you stop speaking a language, conversational fluency drops. Similarly, if a player stops playing tournaments, their competitive edge dulls. The data’s ~31 point drop for inactive players mirrors this effect.
Cross-format transfer reminds me of driving different cars: if you’re excellent at driving standard vehicles (fundamentals), you’ll adapt quickly to sports cars or trucks. The fundamentals scale.
Practical takeaways (for federations, players, and organizers)
Federations
Consider dual-track development: broad talent identification (India model) plus focused elite optimization (USA model). Both work; choose priority based on resources and goals.
Players & coaches
Keep tournament rhythm. The activity-performance link is strong and consistent.
Train fundamentals to benefit multiple formats; format-specific sharpening matters but isn’t everything.
Organizers
Offer mixed-format events and age-inclusive programming: the dataset shows demand across ages and formats.
What I don’t (yet) know and would explore next
Longitudinal career shapes. How do top players’ ratings evolve across decades? Who peaks early vs. late — and why? I’d want panel data across 10–20 years.
Interventions that cause jumps. Which training programs, coaching practices, or support mechanisms produce measurable rating improvements? This requires experimental or at least quasi-experimental designs.
Federation causal factors. Why does one federation produce breadth and another peak performers? I’d collect variables like public funding, coaching density, junior program structures, and socioeconomics.
Non-rating success metrics. Tournament wins, match-improvement under pressure, and longevity in selection teams are not fully captured by ratings. Can we integrate those for a fuller picture?
Psychological resilience and burnout. Given the intense tournament schedules, how does mental health interact with performance trajectories?
Short, concrete summary (so you don’t lose the headline numbers)
Dataset: 1,200 elite FIDE players, 78 federations.
Grandmasters: 872 (72.7%).
Active tournament participation: 97.8% (1,174/1,200).
Mean rating ≈ 2,518; top = 2,839 (Magnus Carlsen).
Age-performance correlation: −0.037 (effectively negligible).
Cross-format correlations: 0.717–0.771.
Active players average +31 rating points vs inactive.
India leads participation (81 players); USA leads average rating (2,546).
Peak mean rating by age: 31–40 (2,526).
Final honest thoughts — what I’d explore if I had your coffee and another afternoon
I’d love to layer in longitudinal data and federation-level covariates next. With that I could start to say more confidently what causes elite emergence, what keeps a player at the top, and what programmatic choices actually move the needle. I’d also interview a subset of players across age groups to understand non-quantitative drivers (life balance, motivation, coaching relationships). That human texture would complement the numbers in a way that charts alone can’t.
Data Source Note:
The dataset analyzed in this article was scraped from the Lichess FIDE ratings list, covering pages 1 through 40.
Published
September 20, 2025